
Welcome to the user guide for the Lemon Hive SiteIQ Audit Tool, available at lemonhive.com/siteiq-audit, and please contact us if you would like to find out more about how we can help you with a new website, app, or software solution.
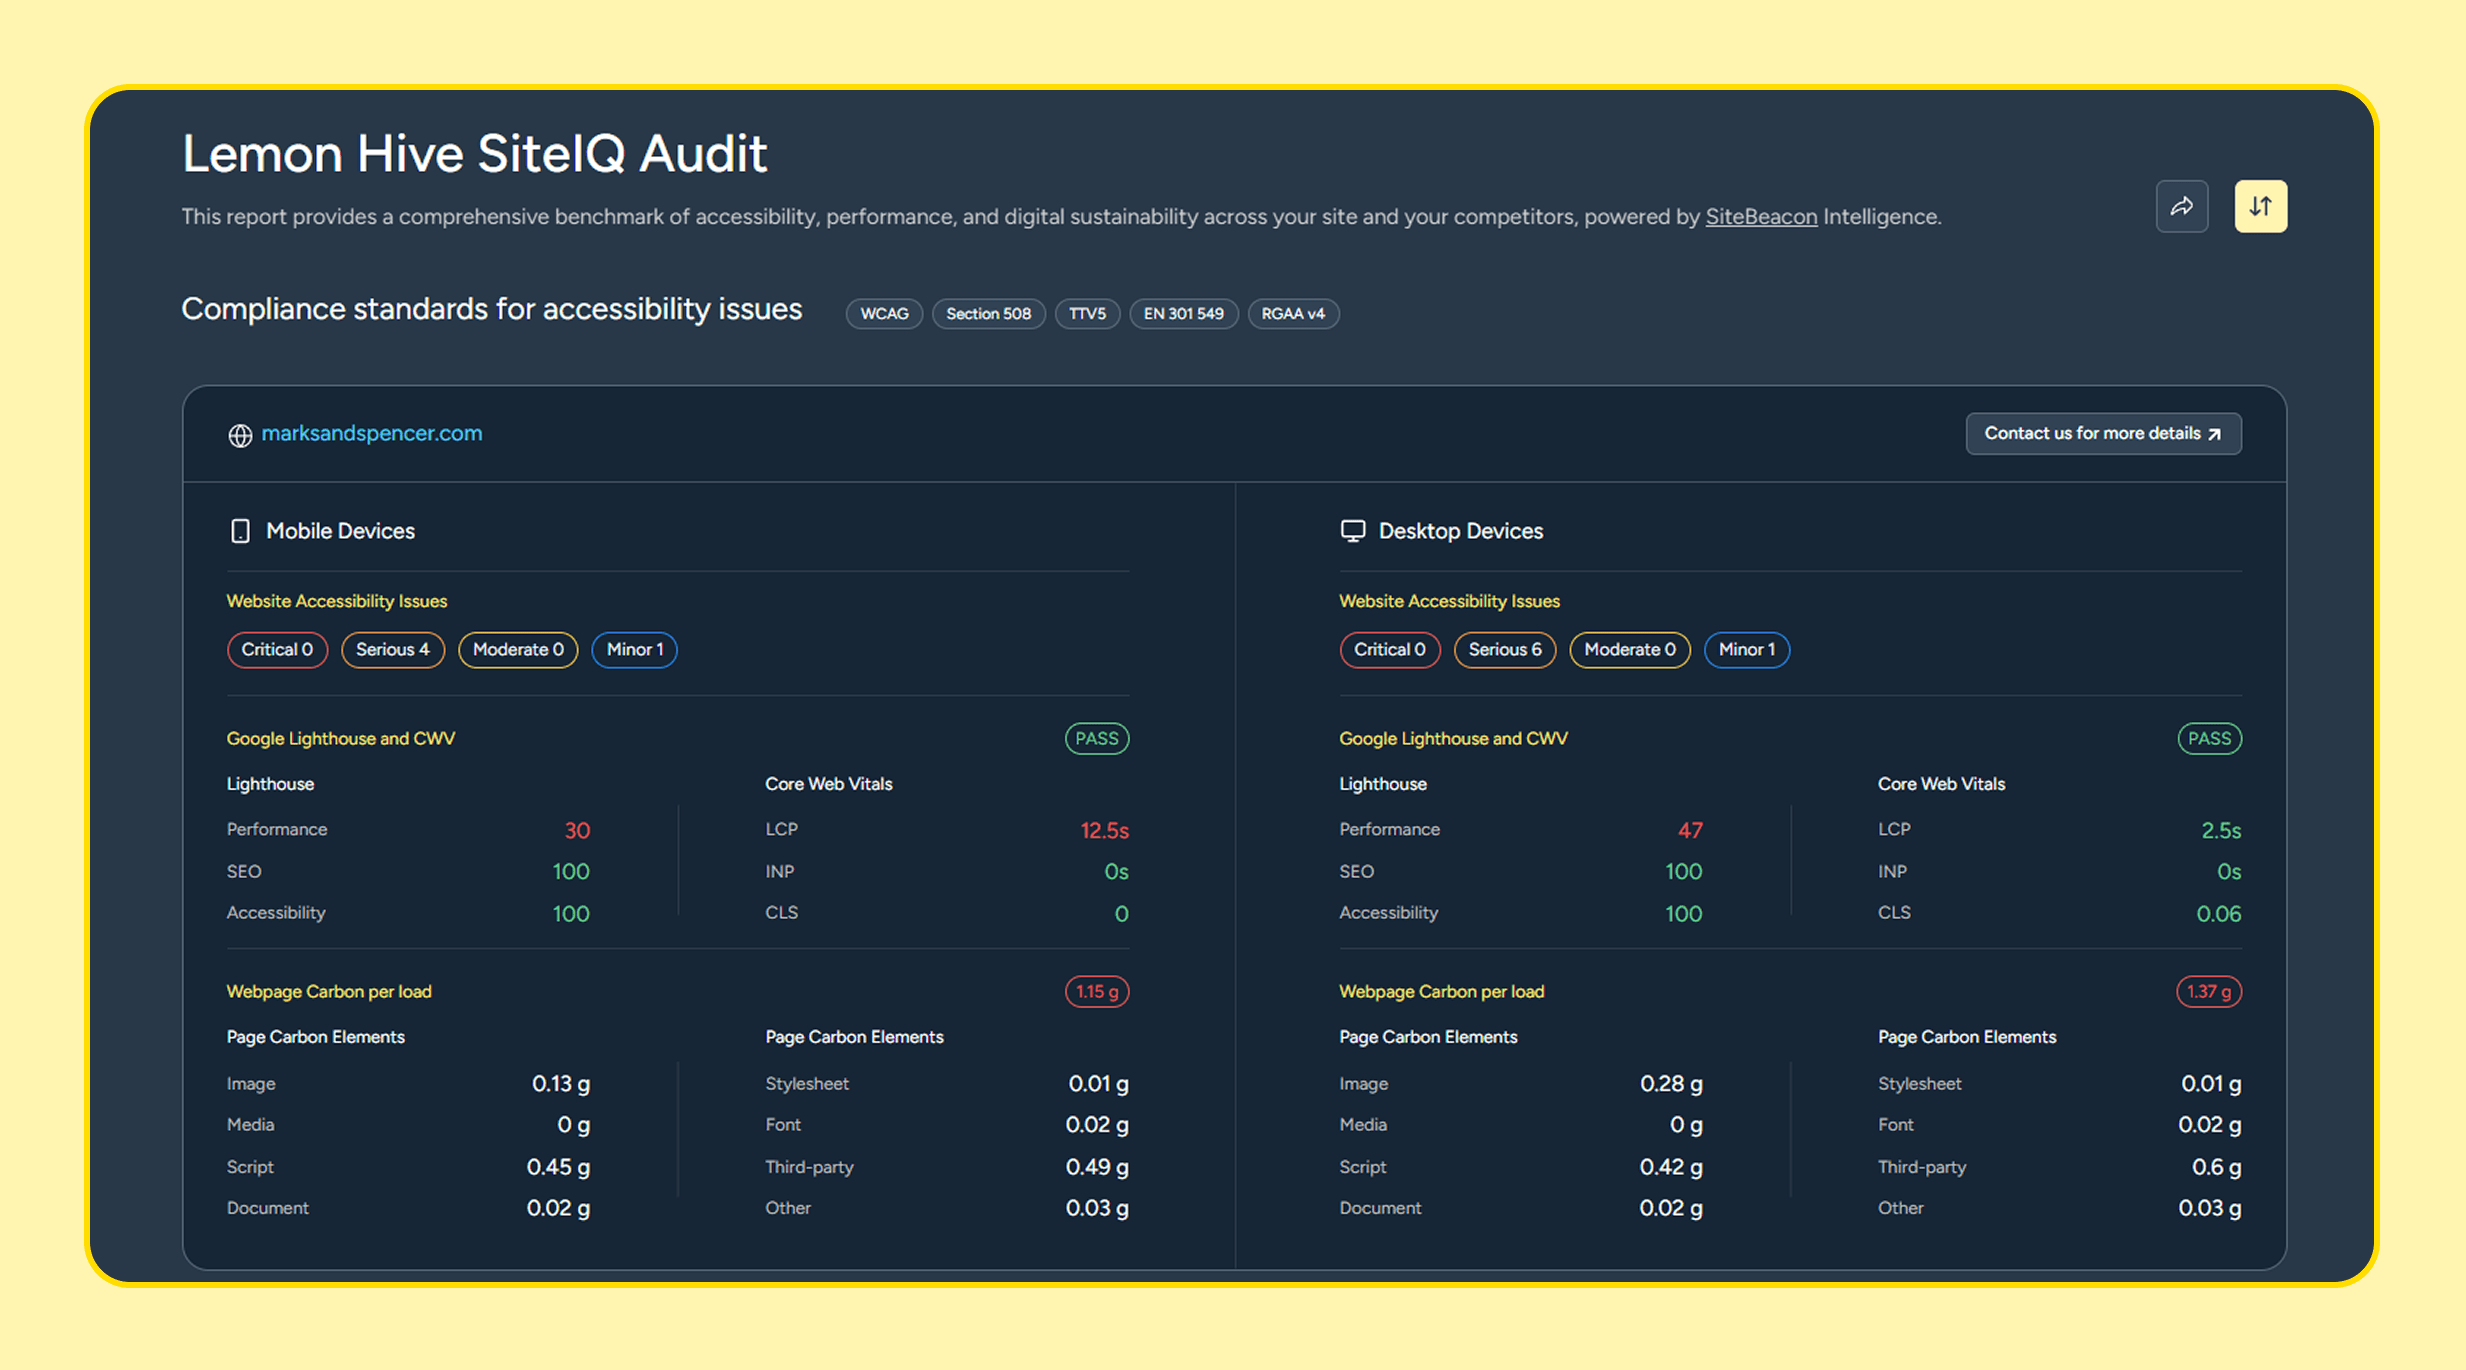
The Lemon Hive SiteIQ Audit is a web page assessment tool that gives you visibility into how well your site performs across key structural pillars: Web Performance, Website Accessibility, Best Practices, Core Web Vitals, and Carbon Emissions (CO2e).
Whether you are auditing a single page, a set of pages from your site, or comparing a collection of competitor sites, this guide will help you navigate the tool and interpret your results to unlock a triple win: faster load times, improved web accessibility, and lower environmental impact.
Getting Started: Running an Audit
Using the SiteIQ Audit tool is straightforward. The interface is designed for simplicity, removing technical friction so you can focus on actionable data.
- Navigate to the tool at lemonhive.com/siteiq-audit.
- Enter the target URLs you wish to evaluate.
The tool allows you to input up to 10 URLs. This makes it great for auditing your site sections or benchmarking competitors. - Fill in your name & email.
- Click Run Audit to generate your audit.
Understanding Your Audit Results
Once the tool completes its analysis, it generates an interactive comparative table. You can view a live sample of the technical output by visiting the Single Site Audit Example or Competitor Audit Example.
The generated table consolidates several complex technical data points into clear, comparative visuals. Below is a breakdown of what each metric means and why it matters to your business.
Key Performance Metrics
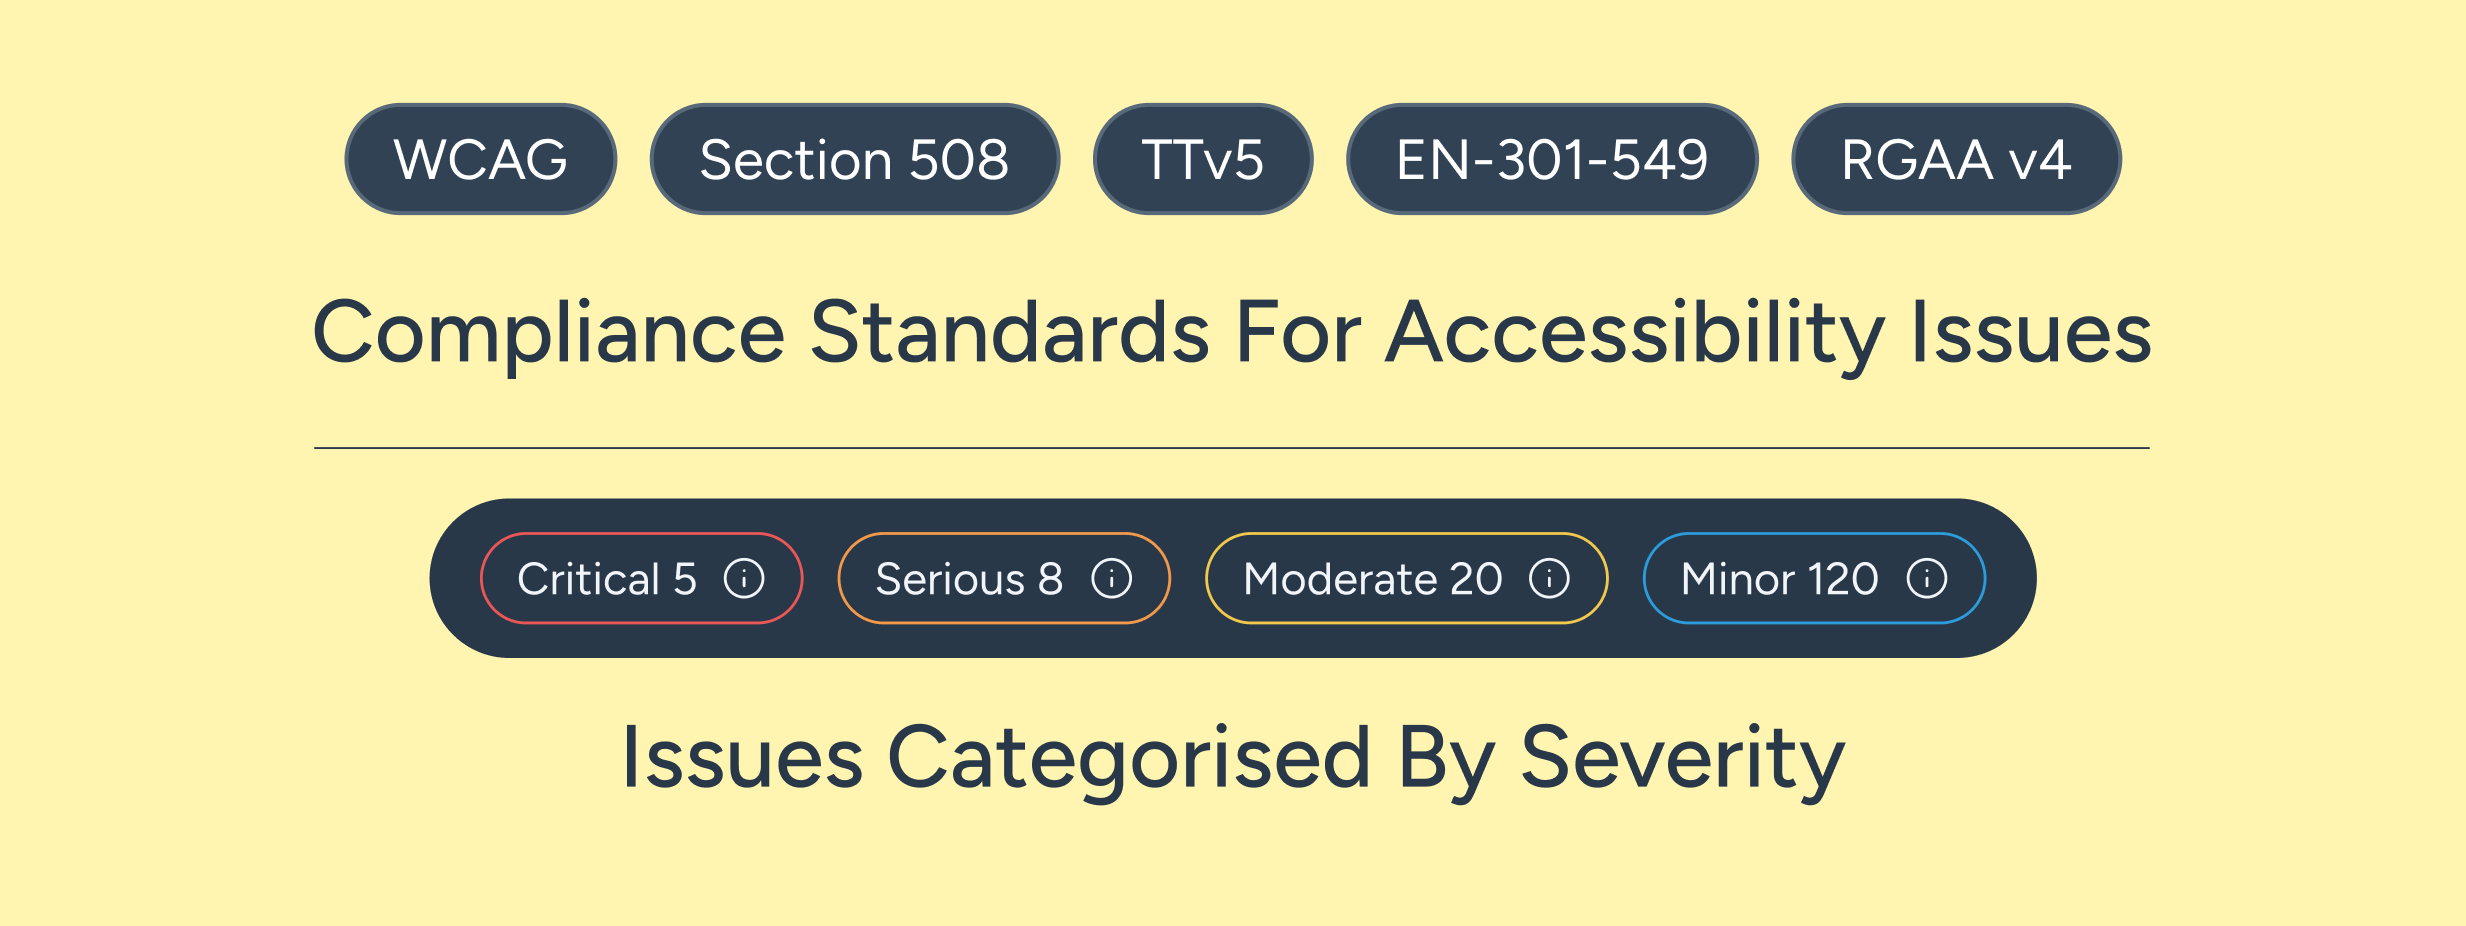
- Accessibility issues (critical, serious, moderate, minor): measured with SiteBeacon.io, a tool we developed to help build better websites. It goes beyond Lighthouse and even Axe, giving you a guide to the issues identified by a range of automated tests. For more information on the issues, please sign up for a free 14-day trial of SiteBeacon.io.
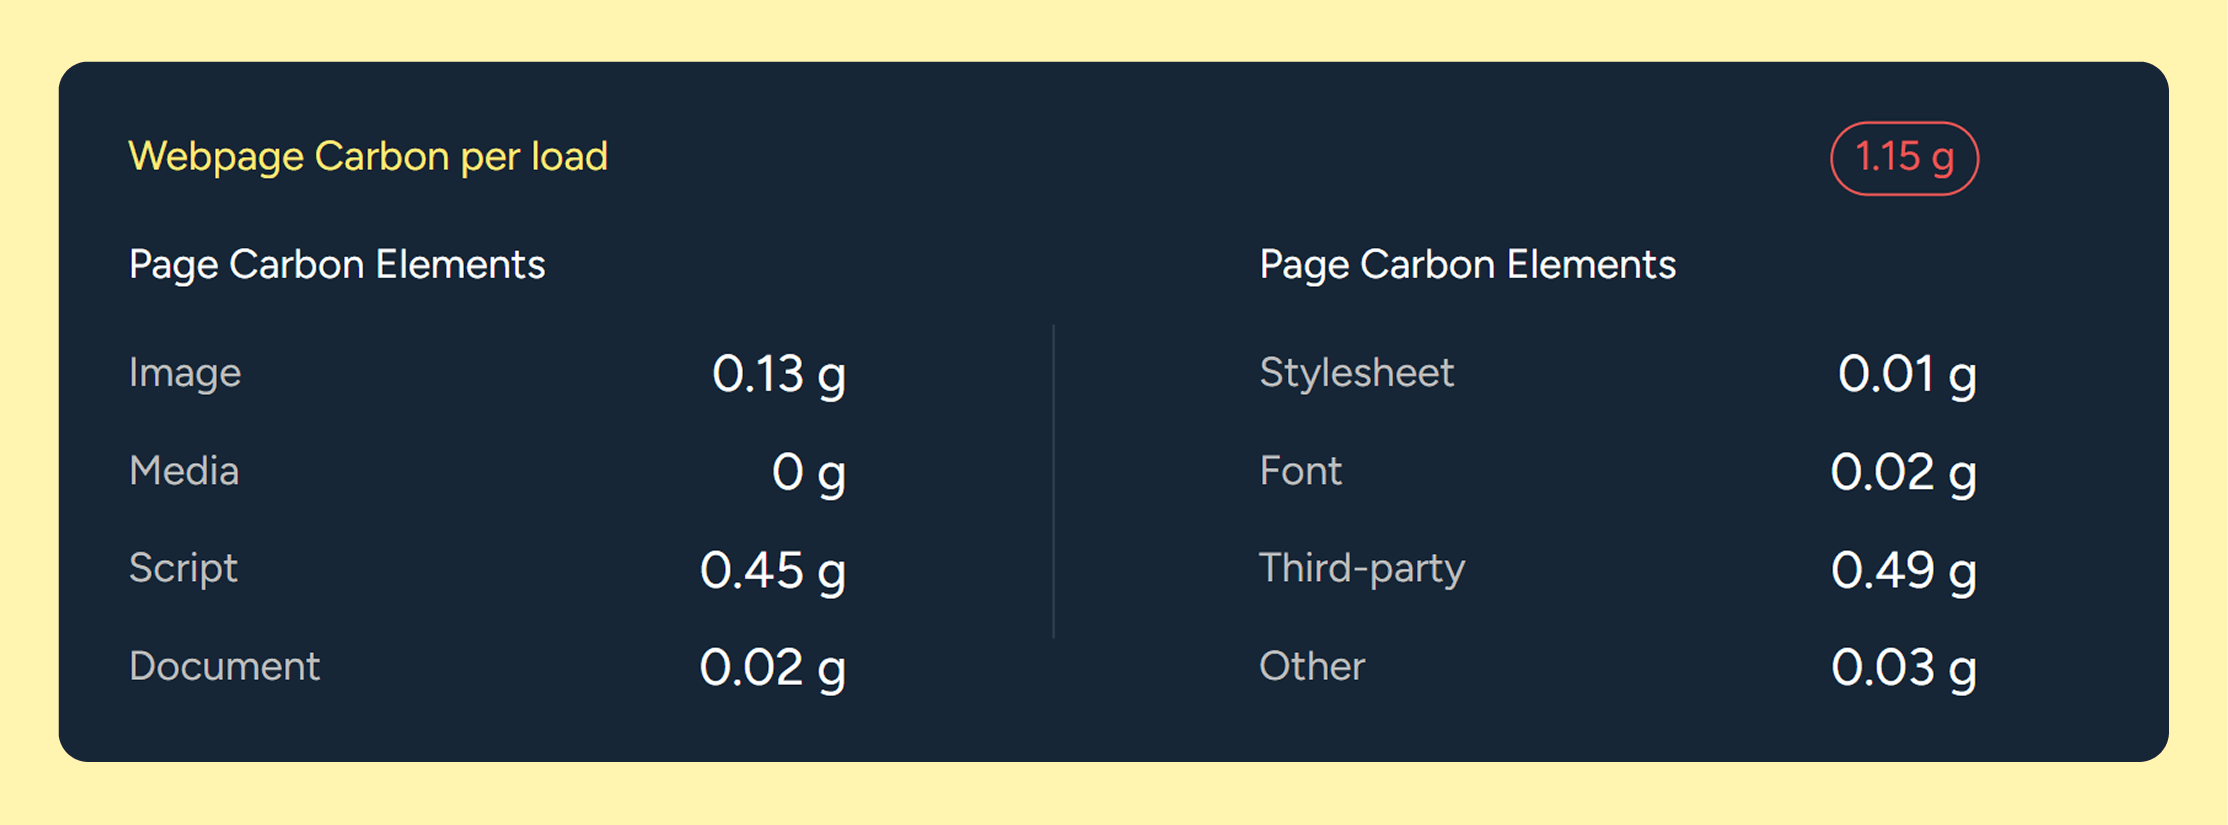
- CO2e (Carbon Emissions): The estimated amount of carbon produced per single page view, measured in grams (g), and utilising our internally developed calculation. Each audit result also includes a Webpage Carbon per Load breakdown, which splits that total figure across eight asset categories: Image, Media, Script, Document, Stylesheet, Font, Third-party, and Other. This gives you a clear view of where the carbon is actually coming from on each page, rather than a single figure in isolation.
- CWV (Core Web Vitals - Pass/Fail): An indication of Google's user-experience metrics (focusing on loading speed, interactivity, and visual stability). This is used as a ranking factor in Google Search Results; the Lighthouse metrics are not.
- Perf (Performance - Google Lighthouse): A score indicating how efficiently the page loads and operates. This looks at factors like speed, responsiveness, and asset delivery. Low scores often indicate bloated codebases or configuration issues.
- SEO (Search Engine Optimisation - Google Lighthouse): This measures how well the page adheres to search engine best practices. A higher score means the page is structurally optimised to perform well in search results.
- ACS (Accessibility Score - Google Lighthouse): This evaluates how inclusive your web page is for users with disabilities and tracks foundational alignment with standards like WCAG. Higher scores mean fewer digital barriers for your audience. SiteBeacon.io's Accessibility Issues provide a more accurate, comprehensive measure.
- BP (Best Practices - Google Lighthouse): Assessment of the page's technical health, including code cleanliness, modern development standards, and security essentials (such as HTTPS).
The Insights: Interpreting the Data
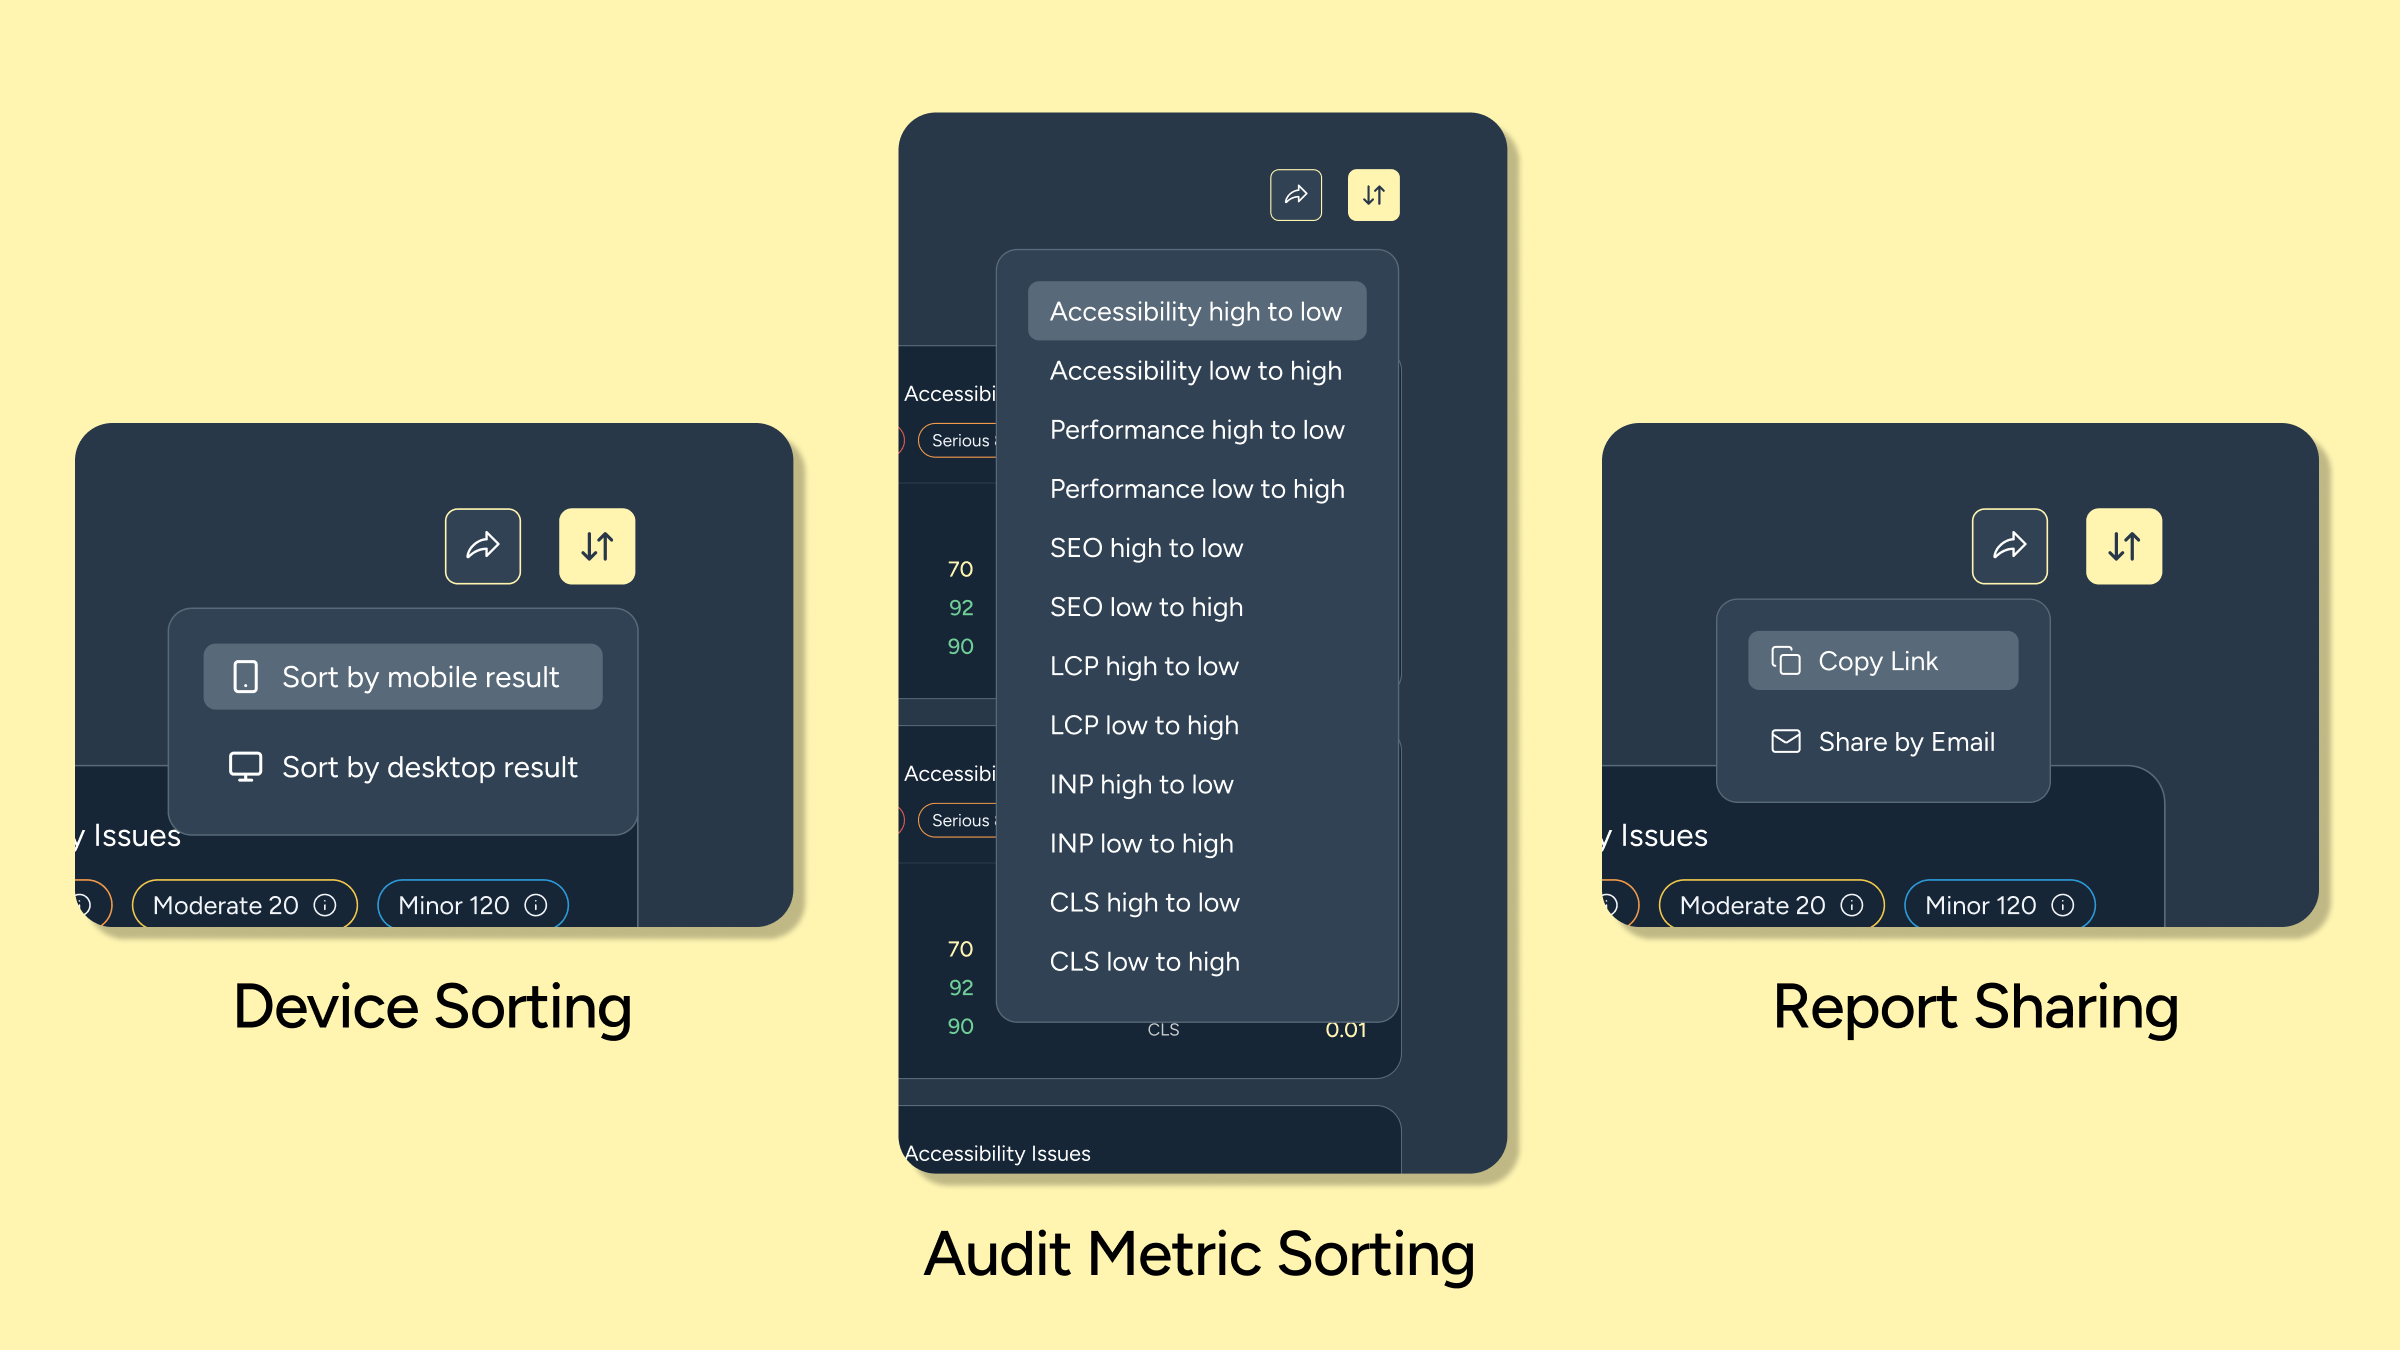
The Sort Function
The sort function has two stages: first, choosing the device type, and second, choosing the measure you want to sort by.
Multi Audit Limits
Each email address is limited to five audits. If you need more, please get in touch with us, and we can update the limits.
Accessibility Issues
We’ve used our own tool, SiteBeacon, to provide powerful accessibility testing beyond what you would find elsewhere. Although we are not providing exact information on issues, it should help you identify where you are and the significance of the issues. Full details of the issues are available in SiteBeacon.io, available with a 14-day free trial of the starter plan.
The High-Performance, Low-Carbon Correlation
The tool frequently highlights a clear relationship between clean architecture and sustainability. Pages with high Perf scores almost always exhibit the lowest CO2e emissions.
When a website is bogged down by inefficient coding practices, such as excessive JavaScript or unused CSS, the browser has to work harder, consuming more processing power and energy. By improving your performance scores, you naturally lower your website’s carbon footprint. The Webpage Carbon per Load breakdown makes this relationship tangible. In most cases, the Script and Third-party categories will account for the largest share of a page's emissions; these map directly to the JavaScript bloat and external tag weight that suppress your Perf score.
Next Steps: From Audit to Performance (or maybe a rebuild)
An audit table tells you where the friction lies, but resolving it requires structural intent. If your Lemon Hive SiteIQ Audit highlights consistently low performance, poor accessibility, or high carbon outputs, standard maintenance patches may not be enough.
At Lemon Hive, we leverage over seven years of engineering experience to help brands transform these insights into robust and elegantly engineered websites, apps and software solutions. We build new websites or omnichannel solutions using modern frameworks, such as Payload CMS, Sanity, Shopify, Next.js and Astro or maintenance packages to update and improve website performance:
- Isolating Failures: We can help you break down bad audit rows to isolate critical failure points, whether that means fixing brittle caching layers, decoupling heavy APIs, or compressing asset delivery.
- Modern Frameworks: If your platform is holding you back, migrating from monolithic systems to modern headless architectures (utilising tools like Payload CMS or Sanity, paired with front-ends like Next.js or Astro) can instantly improve performance, reduce your carbon footprint to grams per page view, and help you improve accessibility.
Run your free multi-URL assessment today at lemonhive.com/siteiq-audit to benchmark your website's health, and explore the rest of our site to learn how we use elegant engineering and our dedication to building better to make the best websites for your brand.